
Behavioral Ripples: A Data Driven Journey Through Emotions and Actions
The article explores the relationship between emotion and behavior through personal self-tracking data, integrating artistic data visualizations to analyze mood influences.

the artist
April 23, 2025
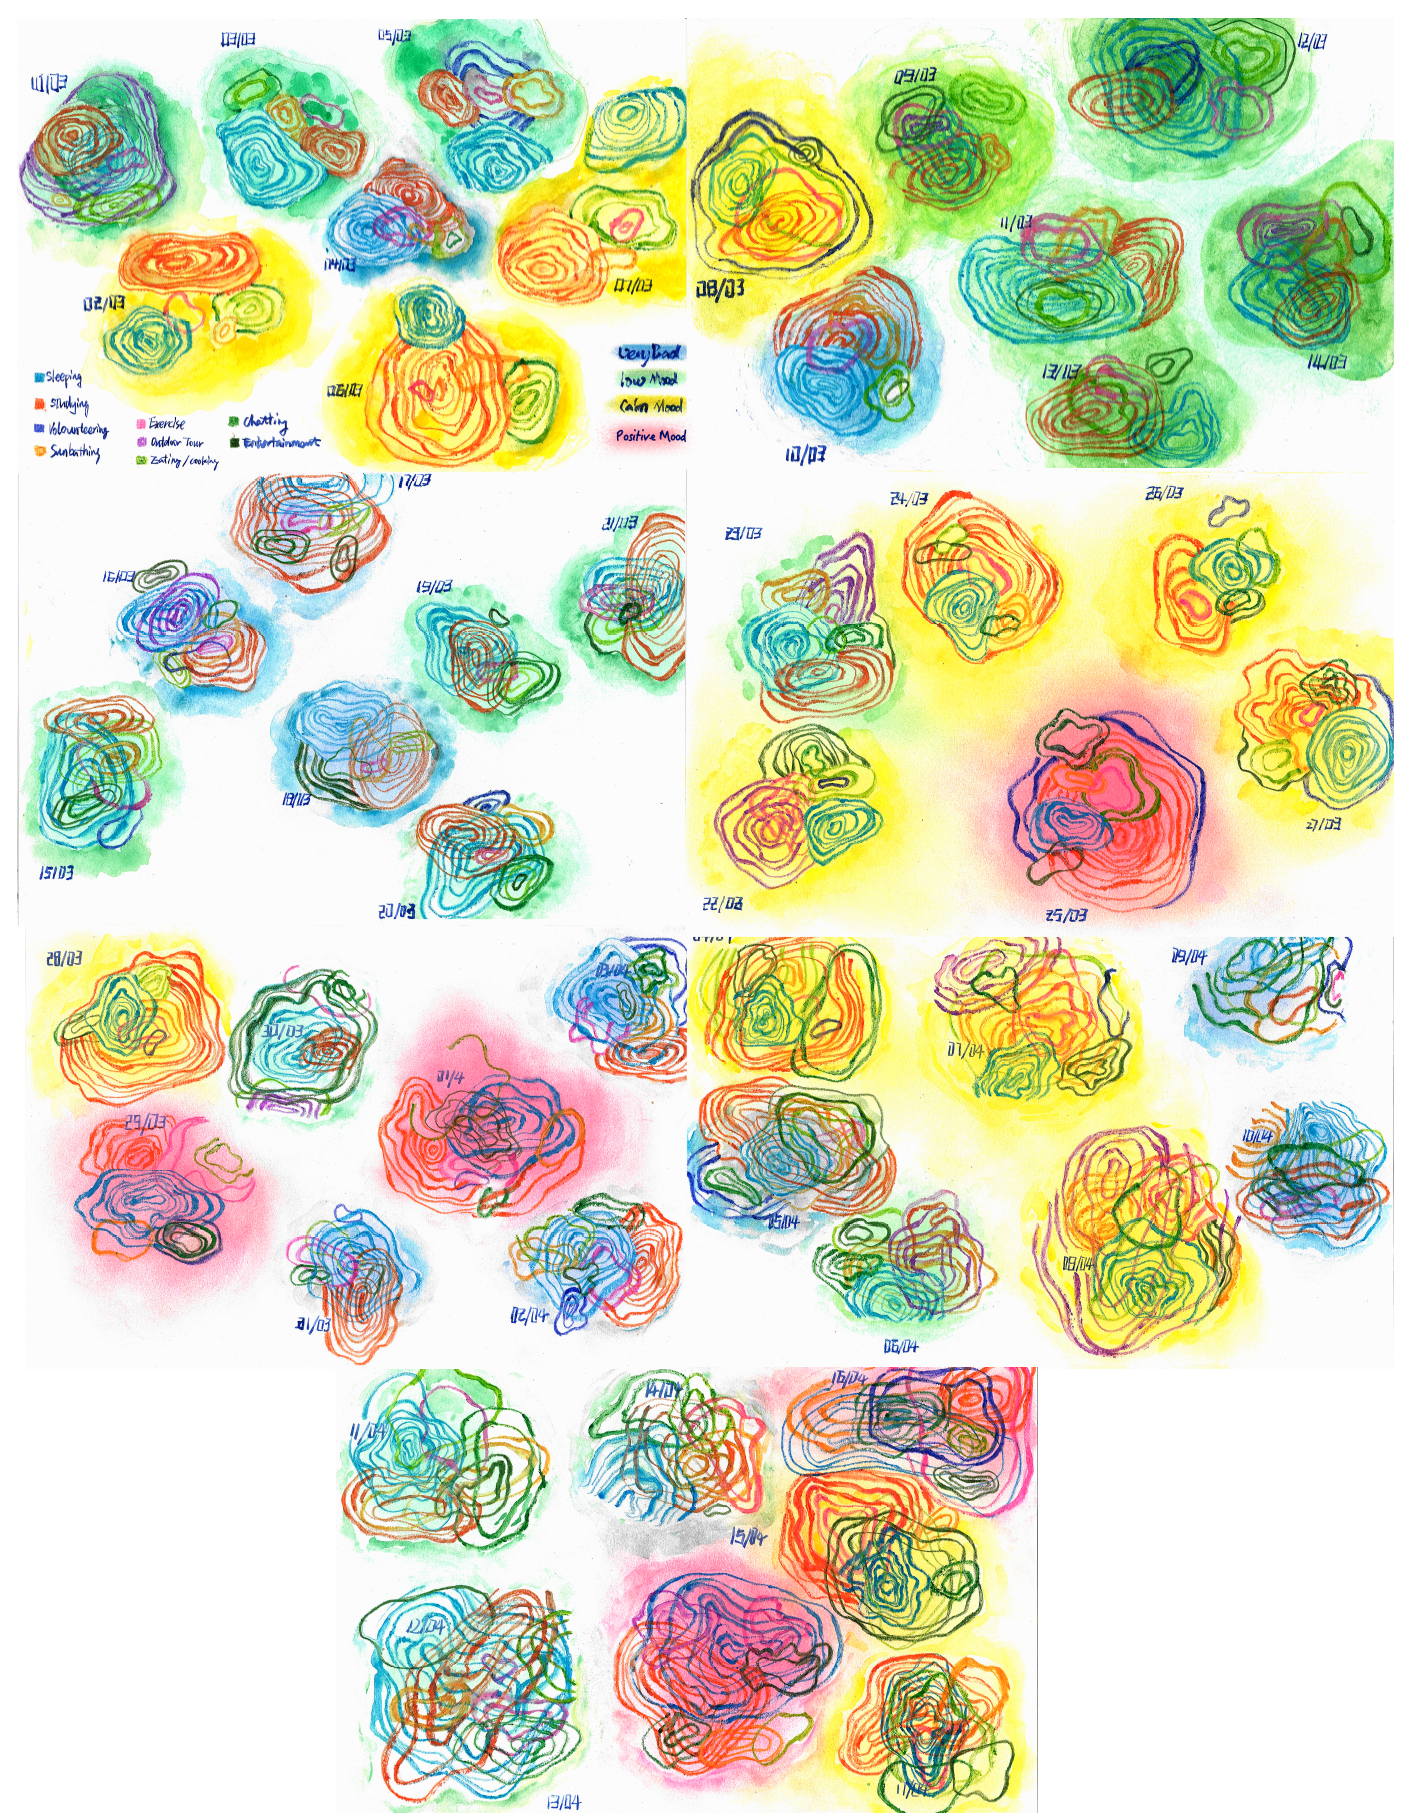
Figure 1. Hand-drawn data visualization by the artist.
Introduction
https://youtu.be/rmnWBRVVz3U
From last year to now, when I came to Ireland, a country full of natural beauty and freedom, I thought my mood would naturally improve, especially after escaping China’s fast-paced, breathless 996 work culture. But surprisingly, my emotional rating often stays below 5 (out of 10). This unexpected gap between expectations and reality makes me wonder: what behaviors really affect my emotions? Do they match the statements of psychology blogs and health experts?
To find out why the emotional index is different from what I expected. Why I still have low moods in my life in a scientific and healthy way of life, I recorded a set of data that are said to be able to improve and stimulate behavior related to dopamine, serotonin, oxytocin and endorphins. These activities include sleep, exercise, sunbathing, social interact, cooking and eating, study and volunteering. I wasn’t just trying to quantify myself—I wanted to see myself differently. Inspired by the visual journal Dear Data and Alvin Chang’s playful data storytelling in The Middle Ages (2025), I chose to visualize my personal metrics not with dry charts, but with hand-drawn “ripples”—a metaphor for how one behavior can influence another.
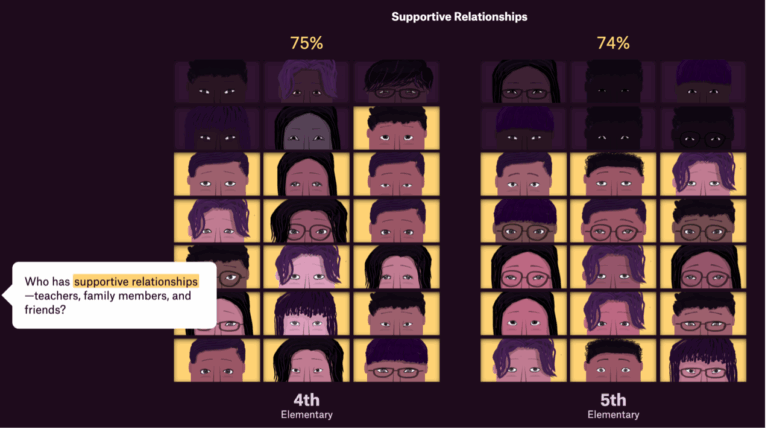
Image source: screenshot of https://pudding.cool/2025/02/middle-school/
Methodology
Over a span of 48 days—from March 1 to April 17, 2025—I noted data each night before bed using a combination of tools: Excel, KEEP (a fitness tracker), Tides (for Meditation and concentration), Moodnotes, iPhone Health, and iPhone Screen Time. To ensure consistency, sleep was recorded for the night before—for example, data logged on March 2 reflects sleep from the evening of March 1.
There were five days when I paused tracking due to illness (April 8–11). I carefully recalled the activities and details of these days, filled out these missing entries based on some APPs and my chat history, and recorded the symptoms and changes. The project focused on eleven behavioral dimensions:
-
Mood (0–10 scale)
-
Sleeping (in hours)
-
Sunbathing (in hours)
-
Exercise duration (in hours)
-
Eating/cooking time (in hours)
-
Studying (in hours)
-
Entertainment (social media, games) (in hours)
-
Outdoor travel (in hours)
-
Chatting (including talking with humans, animals, or AI) (in hours)
-
Volunteering (in-person or online) (in hours)
-
Calorie intake vs. calorie expenditure (kcal)
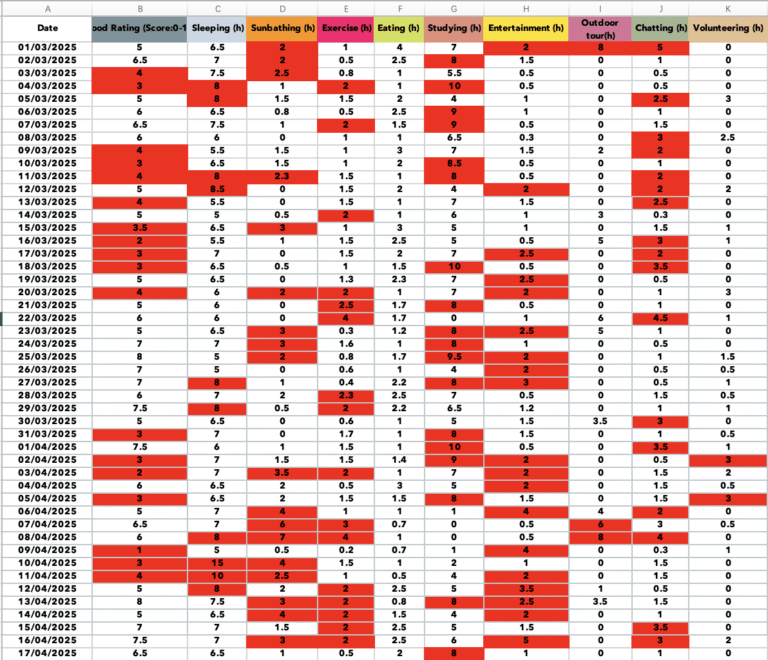
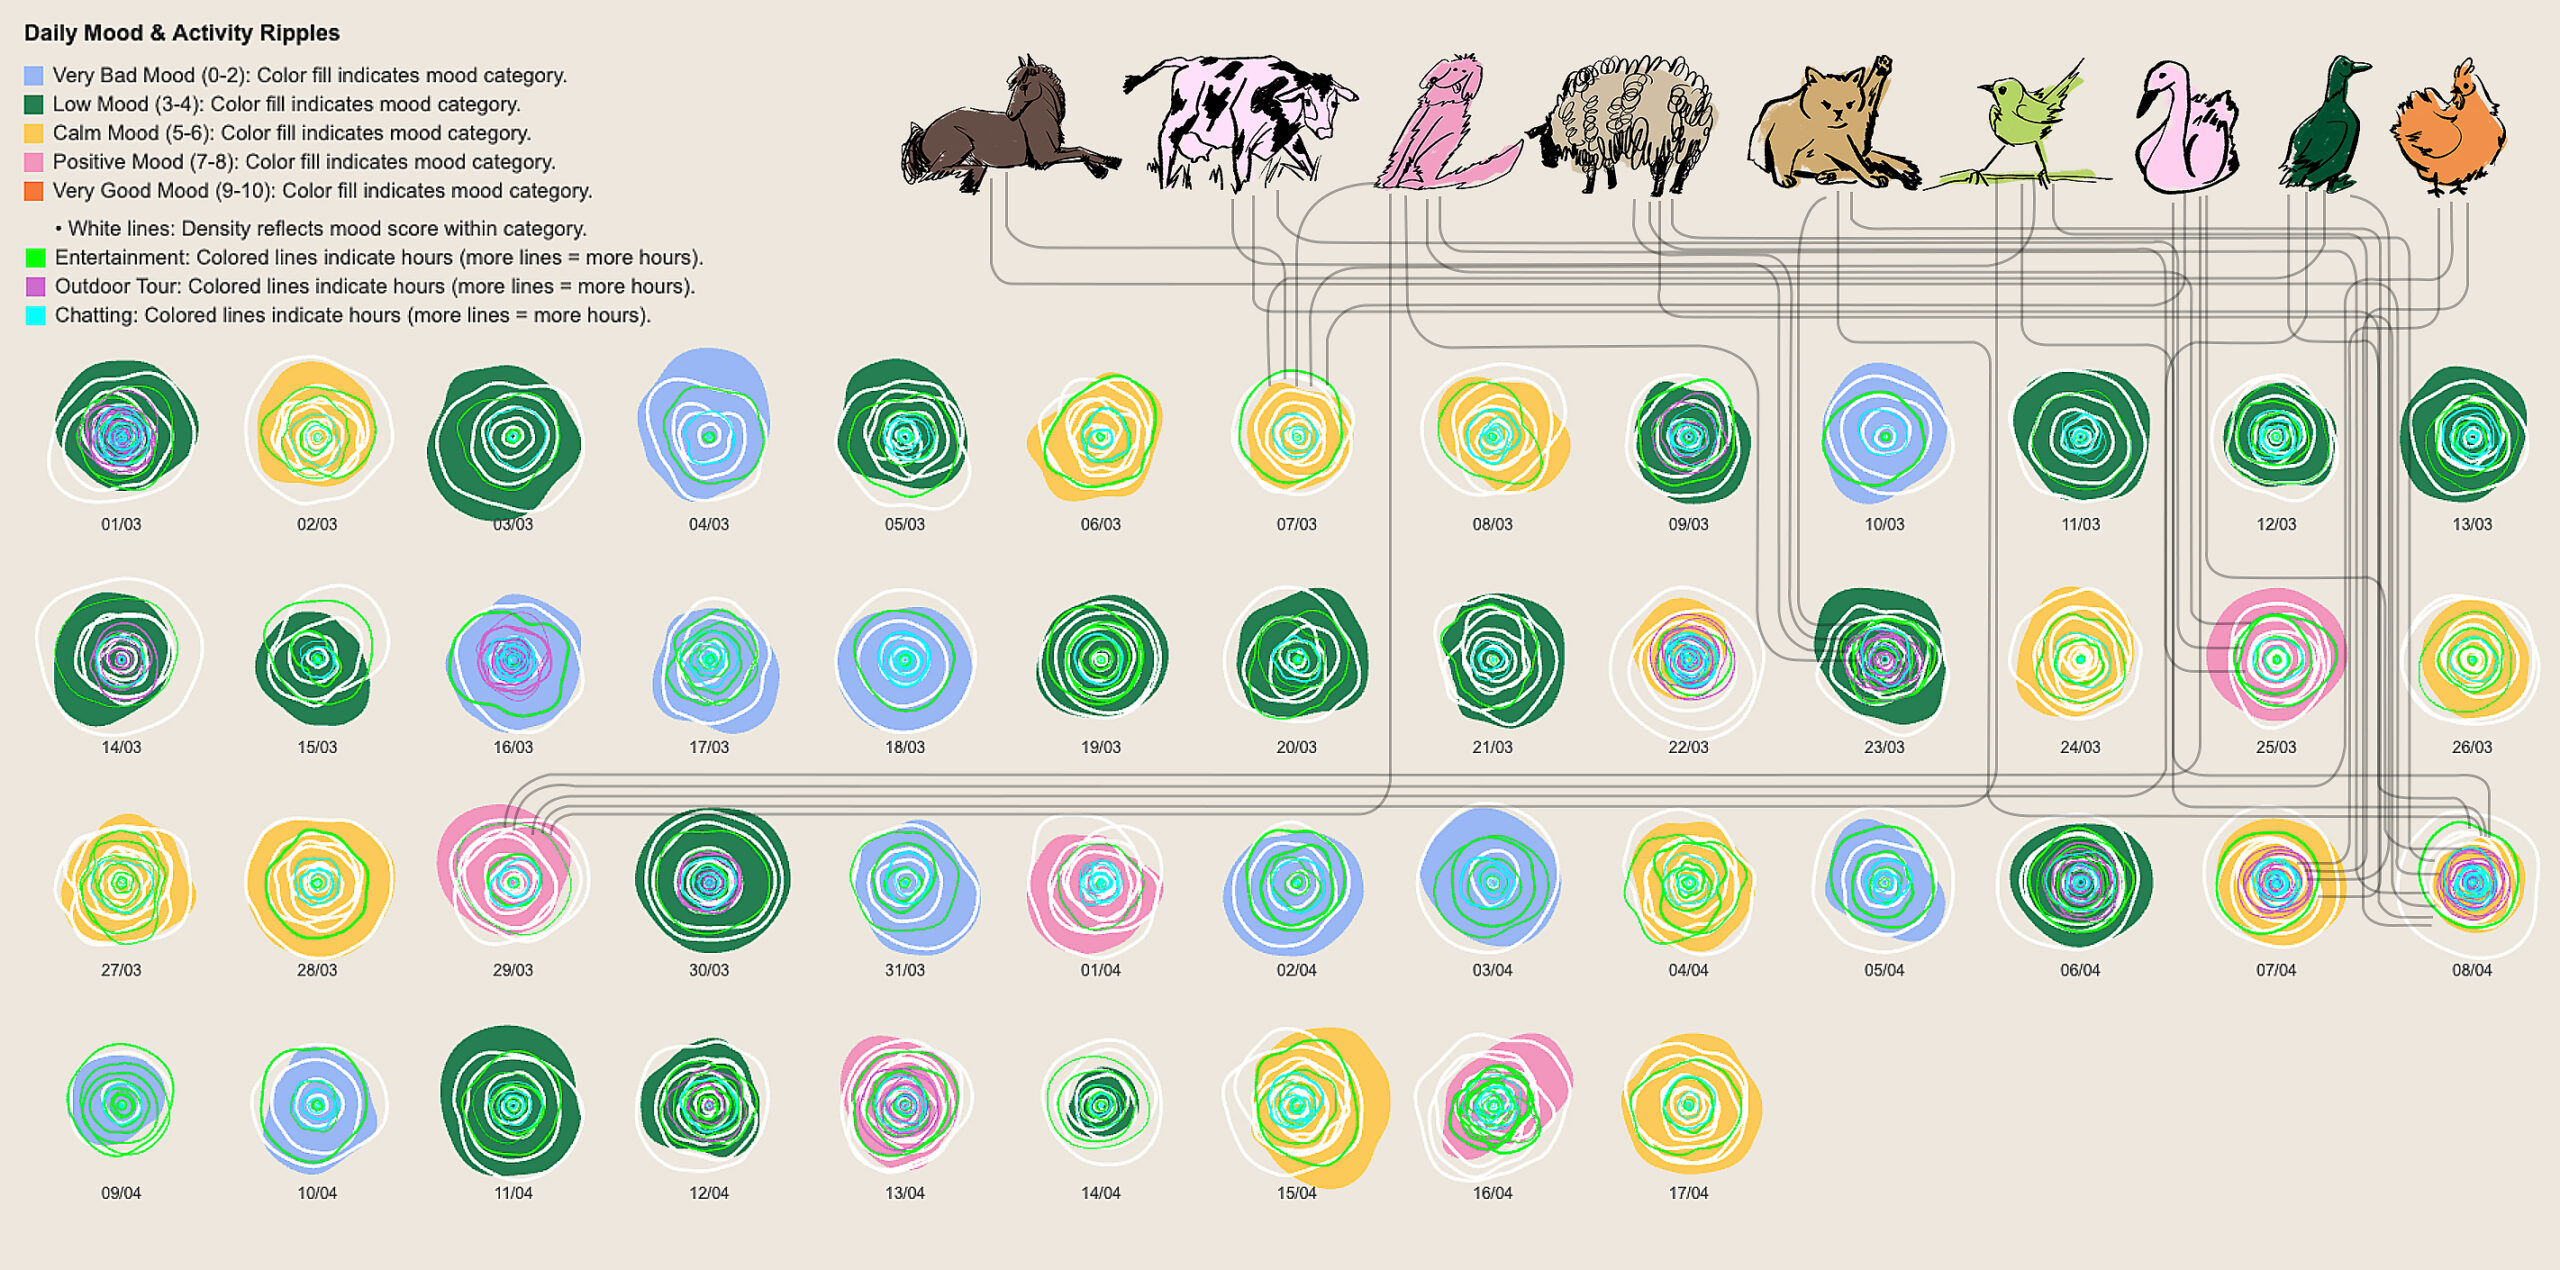
These behaviors were visually mapped as ripples, reflecting the interconnected nature of mood and daily routines. Each data type had a color code, and the ripple sizes represented duration or intensity.
I created visualizations using P5.js and Flourish Studio for digital output, while Hand-painted ripple maps were scanned and refined in Adobe Photoshop. My goal was to blend data with feeling—to express not only what I did, but how I felt doing it.
As Polyck-O’Neill (2023) suggests, data visualizations grounded in artistic practice can capture more than raw information; they can express emotional nuance, narrative rhythm, and lived experience. However, I was also mindful of critical scholars like Pandey et al., who warn that beautiful visuals can sometimes mislead. So, throughout the project, I double-checked each visual representation against raw numbers to ensure accuracy.
The Overall Overview of the Data
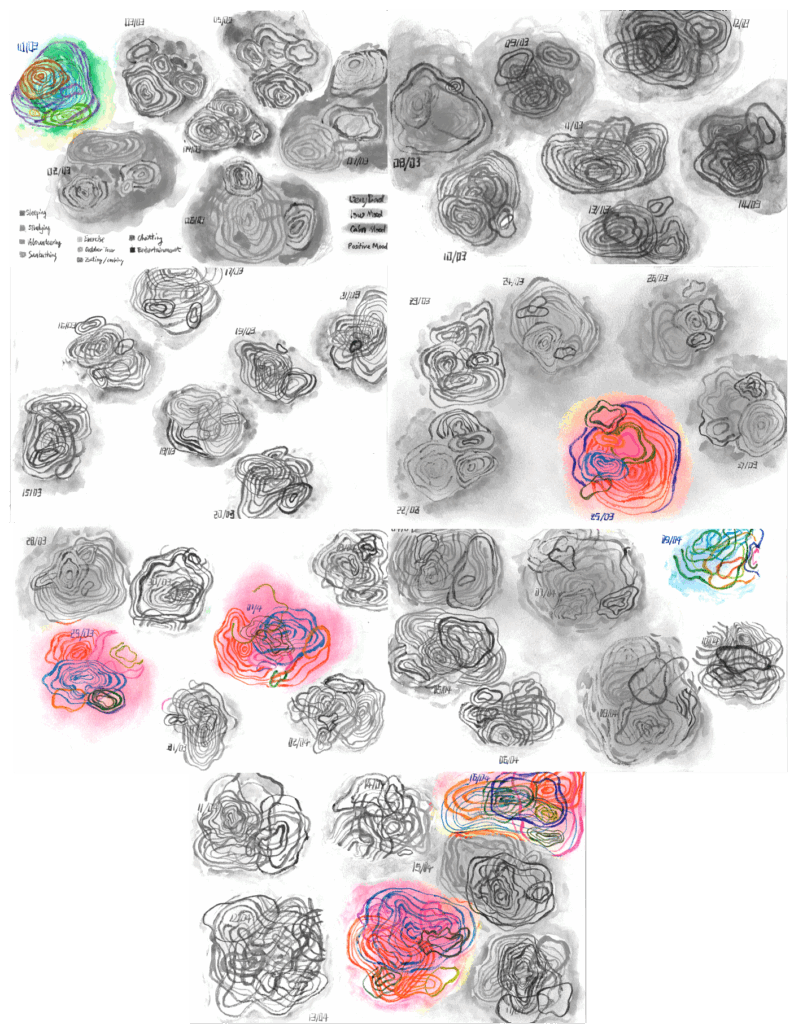
From the overall data, my mood fluctuated a lot, from the highest 8 points (very satisfied and happy and even excited) to the lowest 1 points (frustration and despair), and the lowest point came on April 9 because I had a severe flu and a sore throat that I couldn’t speak. On March 1, we recorded the sounds by the beach at Ballycotton Cliff and initially in a good mood. But later, in order to make the sound recording better, I went to the reef area and ended up falling. Later, my mood dropped to 5.0 and I felt very painful for the next few days. But by March 25, I feel excited and happy again, probably due to the release of sunshine or stress.
Analysis of Behaviors and Mood
Diet and emotions
While preparing this project, I searched Reddit for posts discussing the connection between diet, snacking, sugar, and mood. I came across questions like:
“Does eating more sugar improve your mood?”
“Can diet really affect how you feel?”
As shown in Reddit Screenshot 1, opinions varied, but most responses suggested that food and emotions are indeed linked.
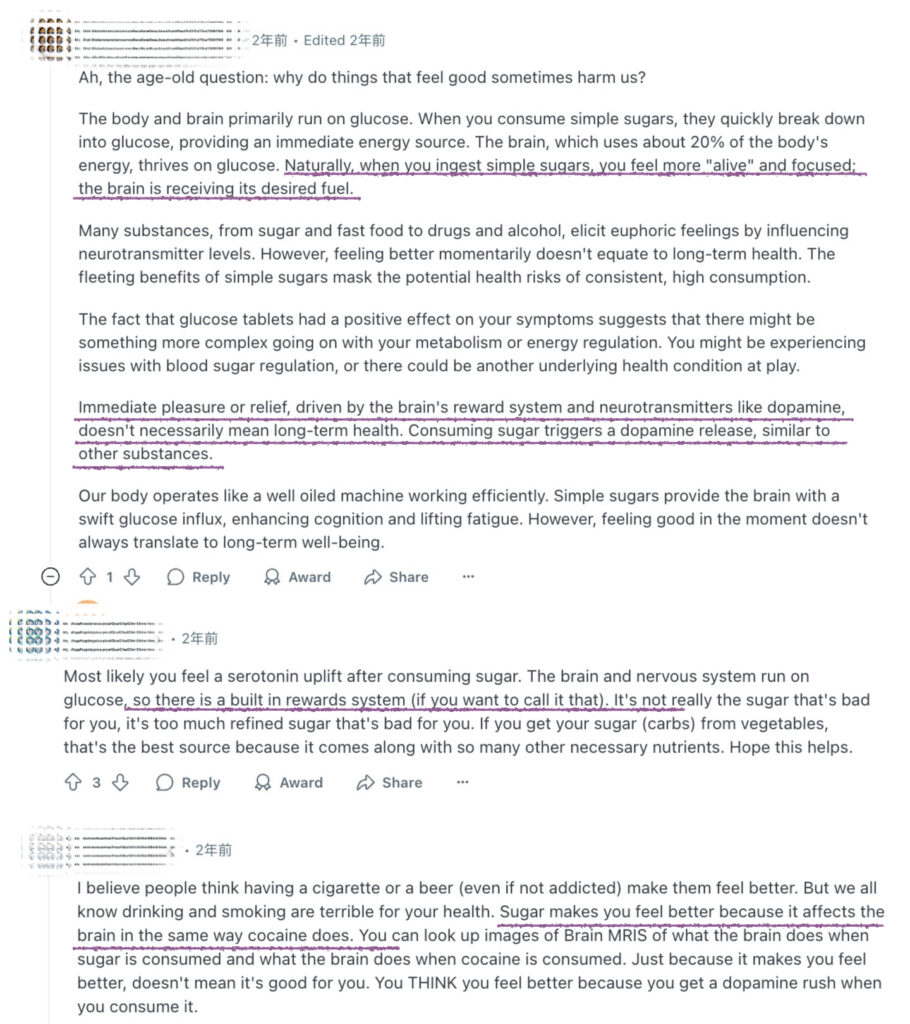
Image source: screenshot of https://www.reddit.com/
On the Keep APP, my daily healthy calories are calculated from my height and weight, so I highlighted the days that I have over 1,400 kcal per day. These days included:
-
March 6: Mood score 6, intake 1,419 kcal
-
April 3: Mood score 2, intake 1,420 kcal
-
April 4: Mood score 6, intake 1,446 kcal
-
April 8: Mood score 6, intake 1,405 kcal
-
April 15: Mood score 7, intake 1,574 kcal (my highest recorded)
I clearly remember April 15 consumption comfort food including chocolate, cake, ice cream, and deep-fried seafood. While April 3 stands out with a low mood, the other high-calorie days recorded mood levels of 6 or above. So:
Could higher calorie intake boost mood?
Possibly yes—at least in the short term. The dopamine response from sugary and fatty foods might explain this trend.
Let’s look at eating duration. For 11 days, I spent more than 2.5 hours eating or cooking. For example:
-
March 15 (3 hours eating): Mood score 3.5
-
March 16 (2.5 hours): Mood score 2
-
March 1 (4 hours): Mood score 5
Despite the time invested, these days didn’t lead to higher mood ratings. Moreover, they often correlated with low calorie intake—sometimes under 1,100 kcal. This suggests that time spent eating and cooking is not a mood determinant.
So, does eating longer make us happier?
Probably not. But indulging in higher-calorie, rewarding food might lead to a temporary emotional boost—unless other emotional stressors are present.
Does More Study Time Lead to Better Mood?
In my memory, I often feel that I spend a long time studying every day. But tracking the actual hours broken this assumption. Most days involved 3–6 hours of academic work, with only a few days exceeding 9 hours. Notably, March 4 and April 2 stood out: both involved over 9 hours of studying and mood scores below 4, possibly due to assignment stress.
However, April 1 was an exception. I studied for 10 hours, presented a multimedia project, and felt proud reflected in a high mood rating of 7.5. This contrast highlighted the emotional difference between productive and pressured study time. Periods of long-term study alone or needing to complete assignments in many subjects often lead to stress and depression, while creative-based tasks lead to concentration and a sense of accomplishment.
From the data, the week before the DH6003 assignment was submitted (March 25 to April 1) did not trigger a significant drop in sentiment. On the contrary, I recorded seven days with mood scores above 6. It seems the act of progressing and completing work—even under pressure—offered emotional relief and control.
Does Sunlight and Sleep Improve Mood?
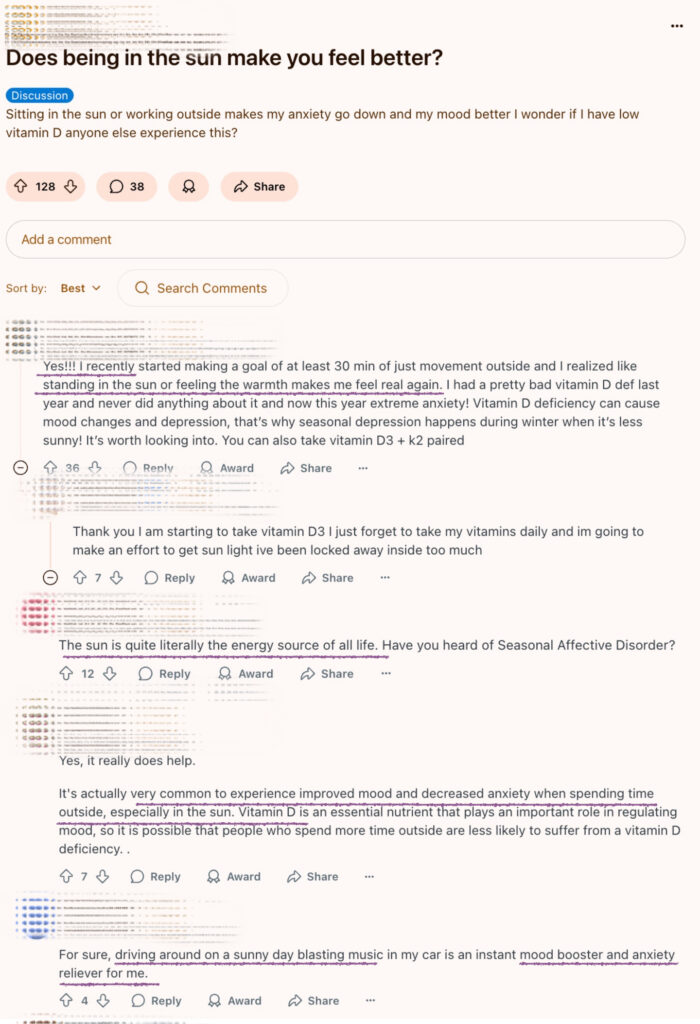
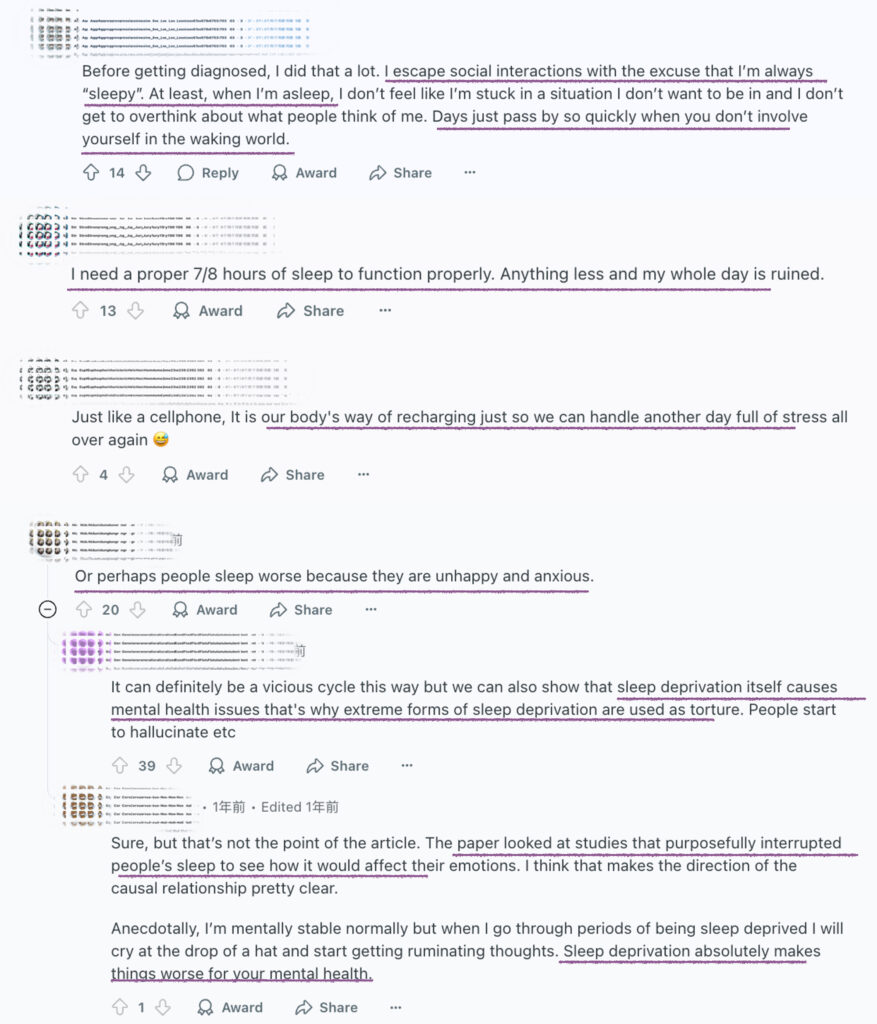
Image source: screenshot of https://www.reddit.com/
Many Reddit users, along with popular science media, suggest that sunlight exposure and good sleep enhance emotional well-being. However, my data reveals a more complex reality. Even after more than 4 hours of sunbathing or 8 hours of sleep, my mood rarely exceeded a score of 6. For example, on April 10, I slept 15 hours and spent 4 hours in the sun yet rated my mood only a 3. Likewise, on April 8, I recorded 7 hours of sunlight but a mood score of 6. This suggests these factors alone may not guarantee mood improvement.
One possible explanation is that my behavior was shaped by popular scientific advice. After learning from sources like Linda Geddes’ lecture that sunlight can boost mood by activating brain regions involved in emotional regulation, I consciously sought out sunlight and tried to sleep longer on days I felt emotionally low hoping to feel better. However, my personal data tells a different story. Even after long sun exposure or extended sleep, I didn’t consistently feel better. This suggests that while scientific recommendations may offer general guidance, their effects are not universal or immediate. Obviously, it is not enough to increase my emotional value to just have high-quality sleep and more sun exposure. Perhaps high-quality sleep and sunlight are not the main determinants, but they cannot be ignored. Because in the log without sunshine and stable sleep, my mood will be worse and more unstable.
Can exercise really boots my mood?
On several days, this pattern held true: moderate workouts (1–2 hours) correlated with mood scores of 7 or above—e.g., March 24 (1.6h, mood 7), March 29 (2h, mood 7.5).
However, longer sessions did not show added benefit. On April 8 and March 22, I exercised for over 4 hours, but mood ratings stayed at 6. This could be due to the fact that after prolonged exercise (more than 2 hours) I get a noticeable feeling of exhaustion, which can also negatively affect my mood. According to my monitoring, especially after my semi-aerobic strength workouts at the gym, I get a strong appetite that leads to overeating and ultimately trigger my guilt. After I began monitoring intake more closely, I noticed emotional dips when I take in exceeded 1,200 kcal, even if I felt physically fine.
Moderate exercise lifted my mood, but excessive activity or food tracking turned a positive habit into a source of emotional tension.
Did fun activities—scrolling, chatting, or going out—make me happier?
The answer is yes, but I’m not sure whether it is because of the reasonable schedule of each activity, or because of the short-term concentration that makes me feel better. My happiest day, April 13 (Emotional Score: 8), which includes reasonable activity schedules: 2.5 hours of media, 3.5 hours of outdoors and 1.5 hours of conversation. Perhaps my emotional improvement usually comes from a reasonable schedule for participating in different activities and a balance of my energy.
Conversely, on low-mood days like April 9 (mood score: 1), even 4 hours of entertainment didn’t help—likely because I was physically unwell.
It is worth mentioning that I found that chatting with animals (dogs, sheep, cows, horses, cats, rabbits, foxes, birds, and even marine life) can help increase mood values in the short term. For example, on March 7, 23, 25, 29 and April 7-8, my mood improved significantly after interacting with animals.
Also, volunteer service allows me to realize my self-worth and improve my mood. Is this true?
My data suggests it might. On days when I volunteered for 0.5 to 2 hours, my mood often improved. For instance, March 25th (1.5 hours of volunteering) had a mood score of 8, while April 16th (2 hours) scored 7.5. However, the effect wasn’t guaranteed—on April 2nd, even with 3 hours of volunteering, my mood stayed low at 3. Overall, moderate volunteering seems to support emotional uplift—but not always.
Final Reflection and Conclusion
Tracking my behavior for over a month has been both enlightening and disorienting. On one hand, the data helped me notice emotional patterns; on the other, it made me question the very idea of measuring emotion. Can we truly quantify how we feel?
At the beginning of this project, I believed following scientific suggestions—sleeping more, exercising, outdoor activity with sunshine—would make me happier. But the reality was more nuanced. These contradictions led me to reflect not just on my habits but on how we engage with data in our everyday lives.
One of my central discoveries is that data is not neutral. Moreover, the emotional scores will also be subjective and lagging. As Simpson (2020) notes, all datasets—and their visualizations—are filled subjectivity. Each data point I logged was shaped by memory, mood, and context. Quantitative self-projects like me usually claim objectivity, but in fact, our life data are often accompanied by many subjective parts.
Polyck-O’Neill (2023) further expands this critique, noting that data visualization can benefit from approaches rooted in visual arts. Rather than striving for clarity and precision alone, I adopted hand-drawn ripple graphics to express how interconnected and fluid mood and behavior felt. These drawings were inspired by Dear Data, but also emerged from my own desire to humanize the charts.
Brinch (2020) reminds us that beauty in data visualization is more than aesthetics—it is a tool for engagement. My hand drawing ripple maps may not have been precise, but they captured something essential: the poetic ambiguity of lived experience. This is what Feigenbaum and Alberda (2023) say when describing comics as emotional carriers, which bring viewers closer to the data by revealing their personal emotional resonance.
Despite its personal insights, the project raised difficult questions. Am I freer now because I understand myself better, or more anxious because I’m obsessing over numbers? As Jourdan Webb (2020) critiques in her work on the quantified female self, fitness apps often reproduce neoliberal and patriarchal pressures—shaping our bodies and identities through surveillance. When my calorie intake exceeded 1200 kcal, I experienced guilt—even on days when I felt emotionally fine. I had internalized metrics as moral judgments.That realization was unsettling. Recording behavior helped me discover triggers and patterns, but it also triggered my obsession with certain behaviors. This aligns with Tuomo Hiippala’s (2020) analysis of multimodal visualization, which calls for more holistic approaches that acknowledge sensory, emotional, and social dimensions of data.
So, are emotions measurable? Yes, it may need to be recorded and analyzed at a more granular level. This project taught me that we can use a more humanistic, aesthetically pleasing, blend of multidisciplinary research to record and analyze data that resonates and leads to deeper research. If I were to do this again, I’d shift focus. Instead of just tracking behavior-emotion links, I’d observe subtle patterns in my environment—like mistakes of weather forecasts, or how many animals I see on walks. These micro-details reflect mood just as much as sleep or calories. I’d also include photography, which I realized late into the project had a surprisingly positive effect on my mood.
As Hiippala reminds us that when the data is multimodal, it is the most accessible. It’s not just charts and numbers, but color, sound, rhythm, and story. That’s how I’ll continue forward: not with a spreadsheet alone, but with curiosity, art, and critical reflection.
References